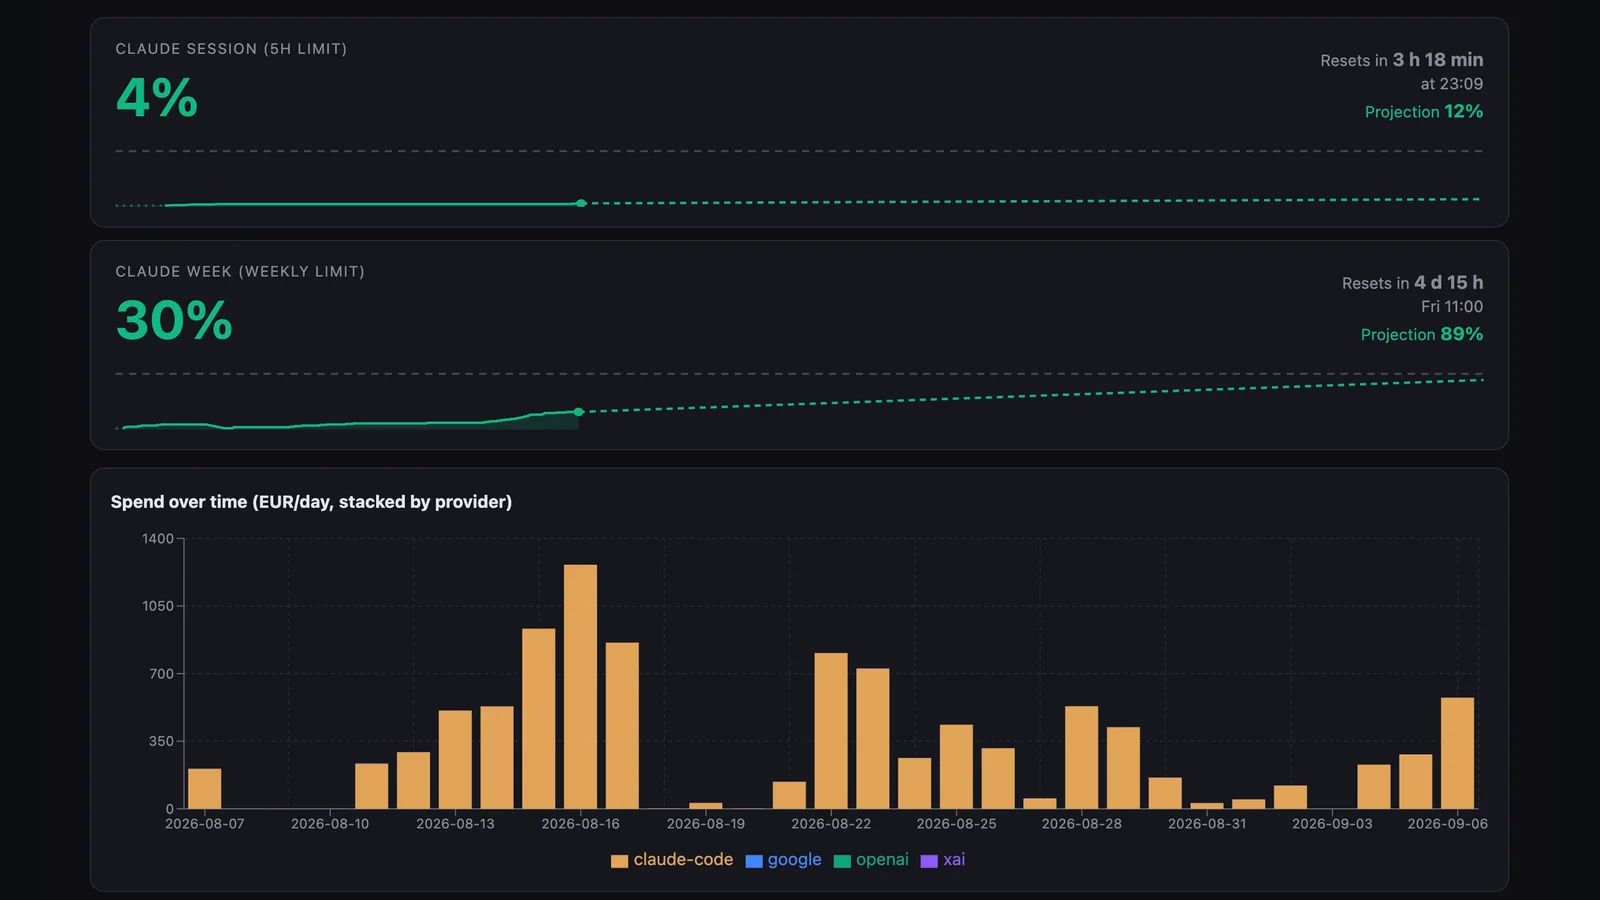
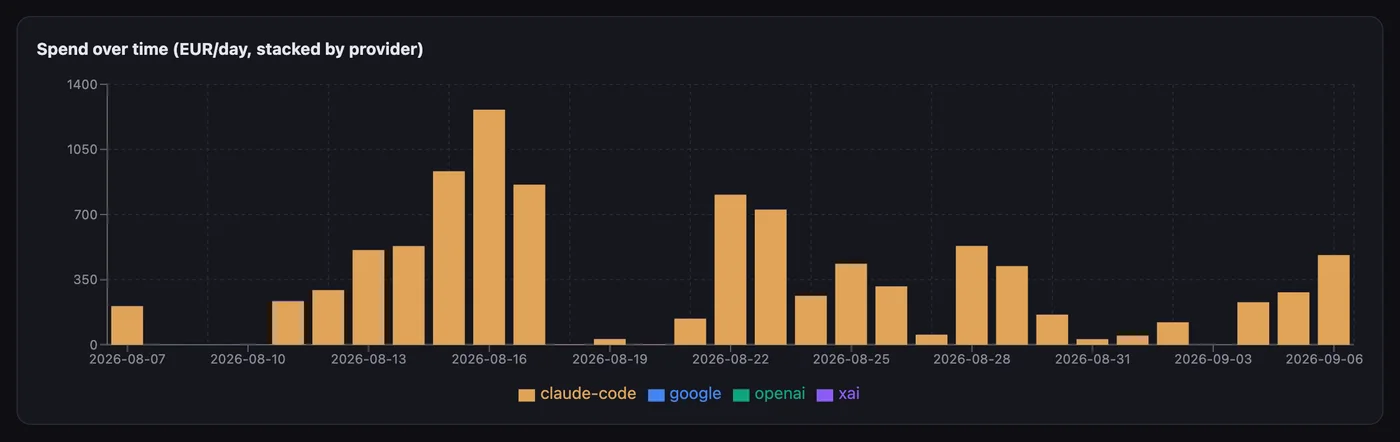
Last month the work I ran through Claude Code priced out at $13,155.00. I paid $200 for it.
Both numbers came out of logs on my own machines this morning. The sentence is true, and it is the most misleading thing I have written on this site. It reads like a bargain. It is closer to a warning, and the rest of this piece is why.
I have already written about what one article costs to produce. That was the unit question. This is the other one: what does the whole thing cost to own, and what did I actually get for it. Everything below was measured on 6 September 2026. Several figures were measured twice on two different machines, because one of the findings is that measuring in the wrong place was wrong by a factor of 5.6.
The number that looks like a bargain
$13,155.00 is the Anthropic list price of 78,281 API calls made over 27 active days. $200 is the monthly subscription that covered them. The ratio is 66 to 1, and I have seen people quote ratios like that as a return on investment.
The trap is in the counterfactual. That $13,155 is not money I saved. It is money I would never have spent. If every call had cost what the price list says, I would have made a twentieth as many and thought considerably harder about each one. The number does not measure a discount. It measures consumption under a flat fee.
My own measuring tool says so in its source comments, which I wrote in August and then failed to take seriously for three weeks: it is not the vendor that is expensive, it is the consumption.
That measuring tool has a page of its own now: what it counts, how it projects the two windows, and the morning it watched me burn a five-hour window in 89 minutes and then wait 67 for it to reopen.

Three ledgers, and I am not going to add them up
There are three cost traces in this house. They are collected by three different mechanisms, on two different machines, over three different periods.
| What it measures | Period | Volume | List price |
|---|---|---|---|
| My own sessions, on the Mac the day shift: me, awake, at a keyboard | 27 active days | 78,281 calls | $13,155.00 |
| The nightly loops, on the ThinkPad the night shift: 14 scheduled agents | 16 days | 159 sessions | $413.46 |
| One content pipeline BlogFactory, brief through publication | 4 months | 3,458 calls | $223.02 |
I cannot tell you the total, because I cannot tell you how much these overlap. The first is measured per machine: the script reads the session files in my home directory and its own comment says so, which means it sees what ran here and nothing else. The loops run on a different machine and report through a different mechanism entirely. Adding these three would produce a number that looks authoritative and means nothing. So I am leaving them side by side and telling you why.
What the split does show is the thing I did not expect. Normalise the first two to a daily rate and the day shift runs at about $487 a day. The night shift runs at about $26. The fleet of agents that works while I sleep is roughly a nineteenth of the cost of the one person supervising it. Every hour I have spent worrying about the price of automation, I was worrying about the small number.
The ledger that booked paid work as free
Now the part I would rather not publish.
The content pipeline has logged every model call it has ever made, 3,458 of them since May. The total says $223.02. That total is wrong, and it is wrong in the direction that flatters me. 1,532 of those calls are booked at exactly $0.00. Not “unknown”. Zero. They were made before 22 June, when the code was reading a field the API had quietly stopped filling in, so every call politely reported that it had cost nothing. May 2026 sits in my books with 618 calls and no money.
The fix was not a better estimate. It was a rule: a call whose price is unknown is booked as unknown and counted separately, never as zero. An invented zero is indistinguishable from a real one, and a sum that reports paid work as free is worse than having no sum at all, because it looks complete.
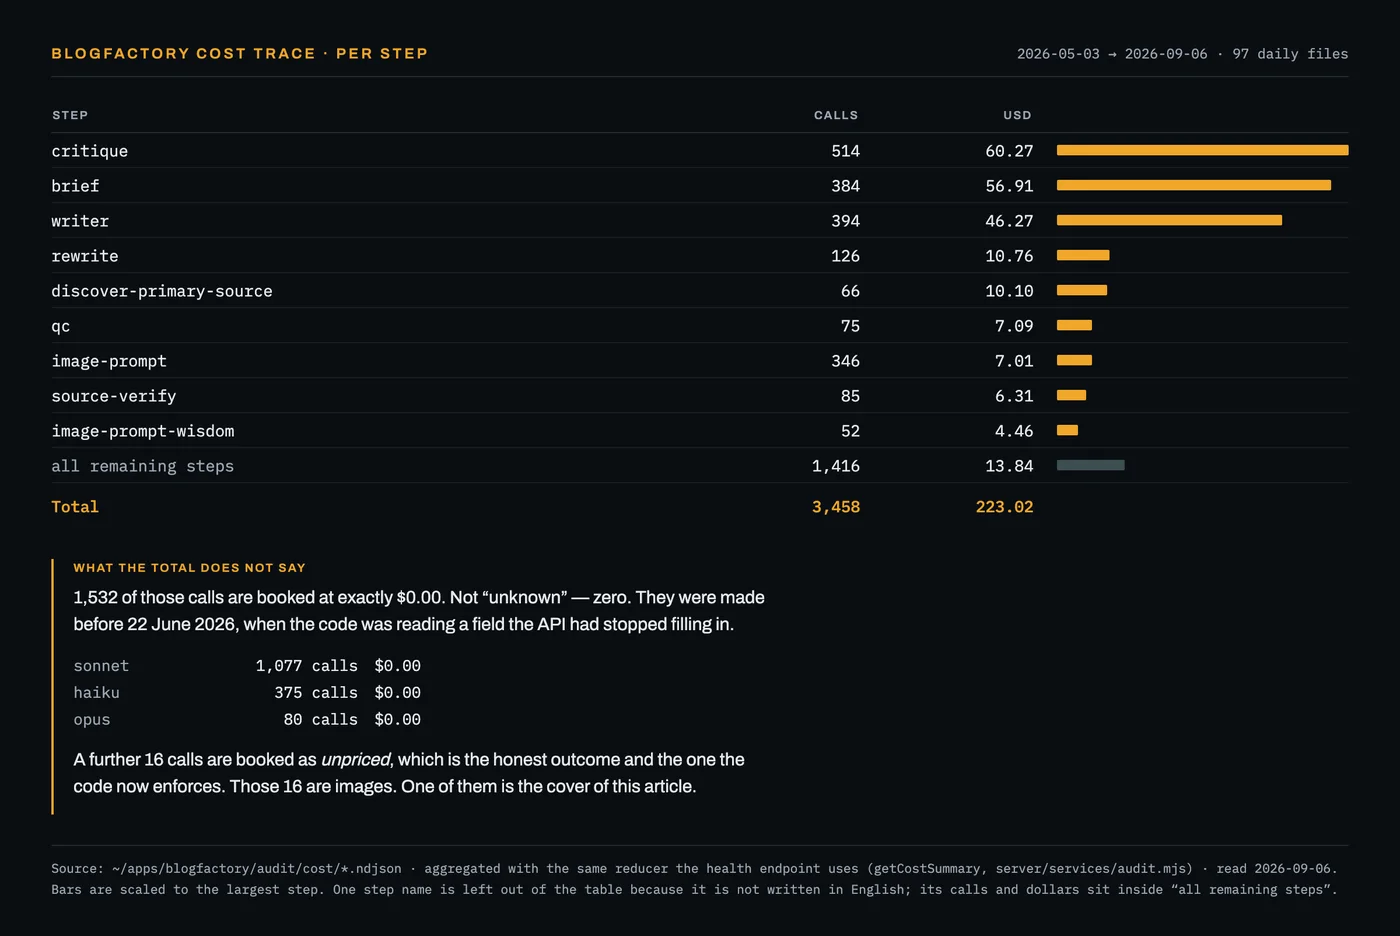
There is a second error of the same family, and it is the one that should worry a reader more, because no code change prevents it. The same pipeline’s cost files exist on my Mac as well. On the Mac they say $39.90 across 1,739 calls in 51 daily files. On the machine that actually runs the work they say $223.02 across 3,458 calls in 97 files. Both are real files. Both parse cleanly. One of them is 18 percent of the truth.
What a free input does to a production line
Here is the consequence of the 66 to 1 ratio, and it is not financial.
When the marginal cost of producing a thing falls close to zero, you stop rationing production. Nothing stops you, because nothing charges you. The constraint moves to the first thing in the chain that is not subsidised, and in a one-person operation that is the attention of the one person who has to approve the output.
In 54 days the machine produced 439 cards for me to decide on. I dismissed 231 of them. That is not the waste, and I want to be careful here, because the easy version of this article would claim it was. A filter that discards half its input may be a perfectly healthy filter, and discarding costs almost nothing.
The waste is the 49 cards that neither shipped nor died. They are queued, or awaiting review, or deferred. The oldest has been waiting 50.8 days. It is not work in progress, it is work in storage, and storage is where value quietly evaporates: a marketing card about a moment that has passed is worth nothing whether or not I eventually click it.
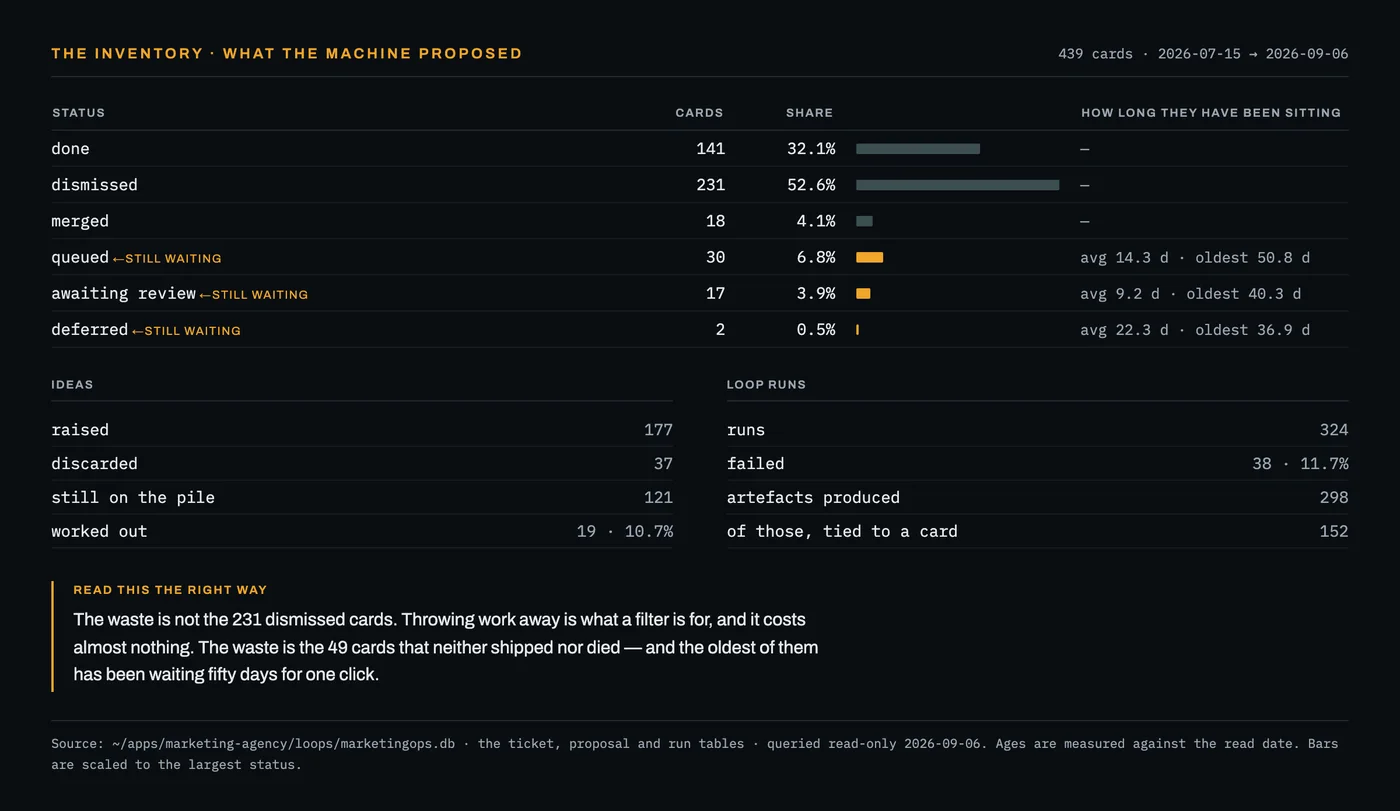
One number keeps me honest about all of this. Across the sites this machine serves, it has published 475 articles and 66 posts. On this site, the one that exists to write about the machine, the publishing pipeline’s own database records six drafts and nothing visible. The three pieces that are live here I posted by hand. The pipeline is not broken. It is waiting for me.
The line that never arrives as an invoice
Which brings me to the largest entry in the book, and the softest.
I do not have a timesheet. What I have is 2,079 commits across 194 days, so I counted them two ways. Counting every 30 minute window that contains at least one commit gives 248 hours. Grouping commits into sessions, taking each session’s span and allowing a quarter hour of thinking before the first commit, gives 216 hours. Two different methods, roughly 230 hours, and both are floors: work that produced no commit is invisible to both.
Put a rate on it and the point survives whatever rate you choose. At 150 euros an hour that is about 34,500 euros. At 50 euros an hour, a rate I would struggle to defend to anyone, it is 11,500. At today’s subscription price the entire 194 days of tooling would have cost roughly 1,100 euros, converting at the same daily rate my cost tool uses. So my own time is at least ten times the cash cost of everything else in this article combined, and at an ordinary consulting rate it is thirty times. I did not have to pick the rate accurately to know that.
The distribution is the part worth sitting with. The home page of this site says that fourteen agents work my projects while I sleep, and that is true. The commit log says 70 percent of the work happens between nine in the morning and five in the afternoon, and that in 194 days exactly two commits landed between midnight and five, which is the window the fleet runs in. Both statements are true at once. The machines work at night. The bill is paid during the day, by hand.
The hole in my own books
I built a cost cockpit specifically so I would know what this costs me. It tracks exactly one recurring line.

Not in that panel: hosting, domains, the search data provider, the social scheduler, the media store, the payment processor, the transactional mail service, the object storage. The API keys for all of them are wired into running services. I went looking for what any of them costs and there is no figure anywhere: not in the code, not in the configuration, not in my notes. That is not a search failure. It is a hole in the books, and it is the same hole as the $0.00 rows, one level up.
Two more I could not close today. The ThinkPad that runs the fleet has been on continuously for the better part of two months, and I cannot tell you what it draws. The kernel interfaces that would answer it are root only, the battery reads zero while the machine is on mains, and I deliberately did not give my own agents passwordless root. So there is no wattage figure in this article, because I would have had to invent it.
And an illustration I generated for this page this afternoon was booked at an unknown price, because the model is not in my price table. The code did the right thing: it recorded the call as unpriced rather than as zero, and printed a warning telling me to add the price. The picture itself did not survive the edit, and the screenshot at the top of this page replaced it. The unpriced line in the ledger stayed, which is a fair summary of where this stands.
Your version of this
If you run a thirty person company with an automation vendor rather than a repository full of agents, none of these numbers are yours. The four holes are.
| The rule | What it looks like in a company |
|---|---|
| Measure where the work happens | Your vendor’s invoice is not your cost. Pull the usage from the system that runs the process, and expect the two to disagree. Mine disagreed by a factor of 5.6. |
| Book unknown as unknown | Any line in a report that reads zero, ask whether it is a measured zero or an absent measurement. A report that cannot tell those apart is not a report. |
| Price the constraint, not the input | Before negotiating a per seat price, find out where the work actually stops. If it stops at one manager’s approval queue, the licence fee is not your problem. |
| Count what you threw away | Ask what proportion of the automation’s output was used. Then ask how long the unused part sat before someone decided. The second number is the one nobody reports. |
The last one is the one I would start with, because it is free to measure and it is the one that changed my mind. I spent months assuming that the interesting question about automation was what it costs to run. On my own numbers it costs about $26 a day to run. What it costs to supervise is roughly nineteen times that, and what it costs to leave the output sitting is not on any invoice at all.
If that sounds like your situation, the useful move is to read these numbers out loud in your own systems before deciding anything. Not the estimate, not the vendor’s figure — the hours your people actually spend, counted for one month. Mine were wrong by a factor I would not have believed until the log said so.
Sources. All figures measured 6 September 2026. Session totals: a read-only script over the Claude Code session files on this machine, which by its own design sees only what ran here. Nightly fleet: the run-cost table in the operations database, 602 rows, 21 August to 5 September. Pipeline: 97 daily cost files on the machine that runs it, aggregated with the same function the health endpoint uses. Cards, ideas and runs: read-only queries against the operations database. Hours: two independent reductions of the commit log, both floors. Where a number could not be measured, this article says so instead of estimating it.