The cost cockpit
Counts what every model in this house costs, and tells me how many minutes of Claude are left before the door shuts.
36 commits · first 16 Jul 2026 · last 15 Sep 2026 · 61 days
commits per week, counted from the repository when this page was last built
A flat rate with a wall in it
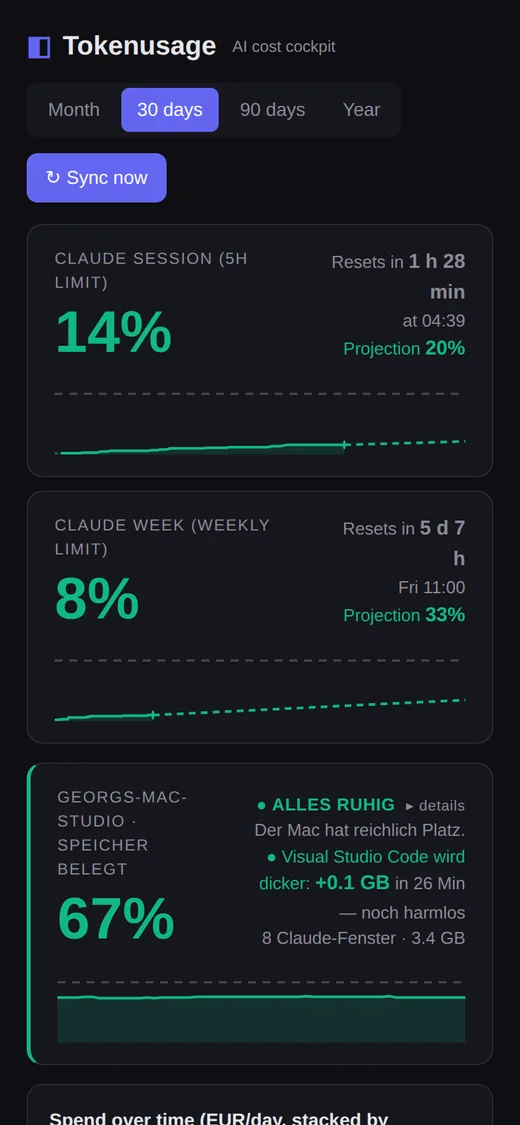
The subscription costs 200 US dollars a month and contains no bill. What it contains instead are two windows: a five-hour one that refills, and a weekly one that does not. Both are reported as a bare percentage — no money, no tokens, no history, no forecast. There is no invoice to check afterwards, and no warning before.
So you find out you have run out by running out. The work stops mid-sentence, and from that second there is exactly one question: when may I continue? That question had no answer anywhere on my machine. And beside the subscription sit four providers that do send bills, in two currencies, on their own days, with no shared place to add them up.
Everything below is one tool answering two questions that turned out to be the same question: what did this cost, and how much of it is left.
First commit
3c053e7 16 Jul 2026
The first commit is not the day the tool was written. It is the day it got a history: it had been running for weeks in a directory with no repository in it at all.
The change that went in with it set the tone for everything after. The five-hour banner kept disappearing whenever the login token hiccuped, because an empty catch block swallowed the error and the display had no way of saying “I do not know”. Since that commit the last good value is passed on for up to thirty minutes and marked stale instead of vanishing. No value, and a value I no longer vouch for, are two different states — and telling them apart is most of this project.
A display that goes quiet is worse than one that says it is broken
6138974 26 Jul 2026
The session tile vanished without a word, and at the same moment the weekly limit read 0 % and $0. Two entirely different failures behind one blank screen: the server’s login token expires roughly every eight hours, and separately the local log mirror the weekly figure is computed from had been frozen for eight days.
Three repairs, and only one of them is about fetching data. The retry backs off instead of hammering every five minutes — Anthropic had already been throttling it with HTTP 429 — and the reason for the gap became part of the answer instead of a shrug. The automatic calibration stopped writing rows with zero cost in them: ten such rows crowd the useful ones out of a ten-row window, and the weekly budget then disappears without anything looking broken.
The third is the one I would repeat anywhere. Where a live value is missing, the tile now says so, with the reason and the time since. A gauge that looks the same when it is broken as when there is nothing to show is not a gauge.
504 pushes a week, from a key that wobbled
0d0a9cb 5 Aug 2026
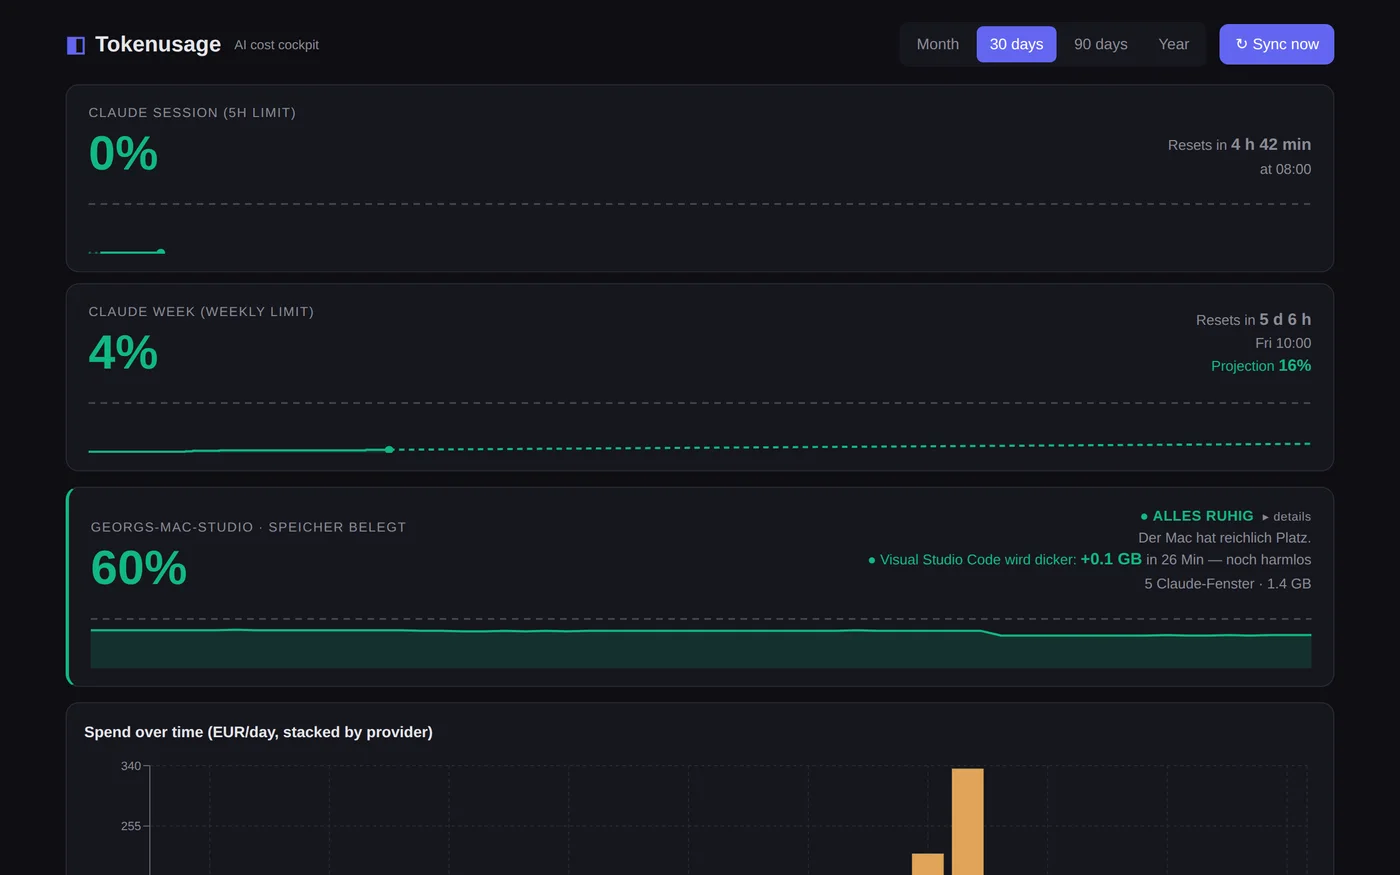
Anthropic reports the reset time of a window with microseconds, and the value shifts by fractions of a second from one call to the next: 09:00:00.086222, then 08:59:59.735795, then 09:00:00.294811. Used as the identity of a window, that means a new key every hour, and therefore a new alarm every hour — although a uniqueness constraint in the table was there to prevent exactly this. On the phone it was 40 of 52 pushes in twelve hours, 504 a week, the same three lines at midnight, at one, at two.
The repair rounds to the full hour instead of truncating. Truncating would still have separated 08:59:59 from 09:00:00, and the test keeps that counter-check: the obvious one-line solution would not have been enough.
The rest of the commit is about noise rather than bugs. Fifty and seventy-five per cent of a weekly limit are information, not alarms, and stay in the log. Between ten at night and seven in the morning alarms are held and delivered later rather than dropped — a swallowed alarm would be worse than a late one. An alarm that cries wolf is switched off within days, and after that it is also missed on the day it is right.
The test suite wrote into the dashboard it was testing
7bbd9e8 11 Aug 2026
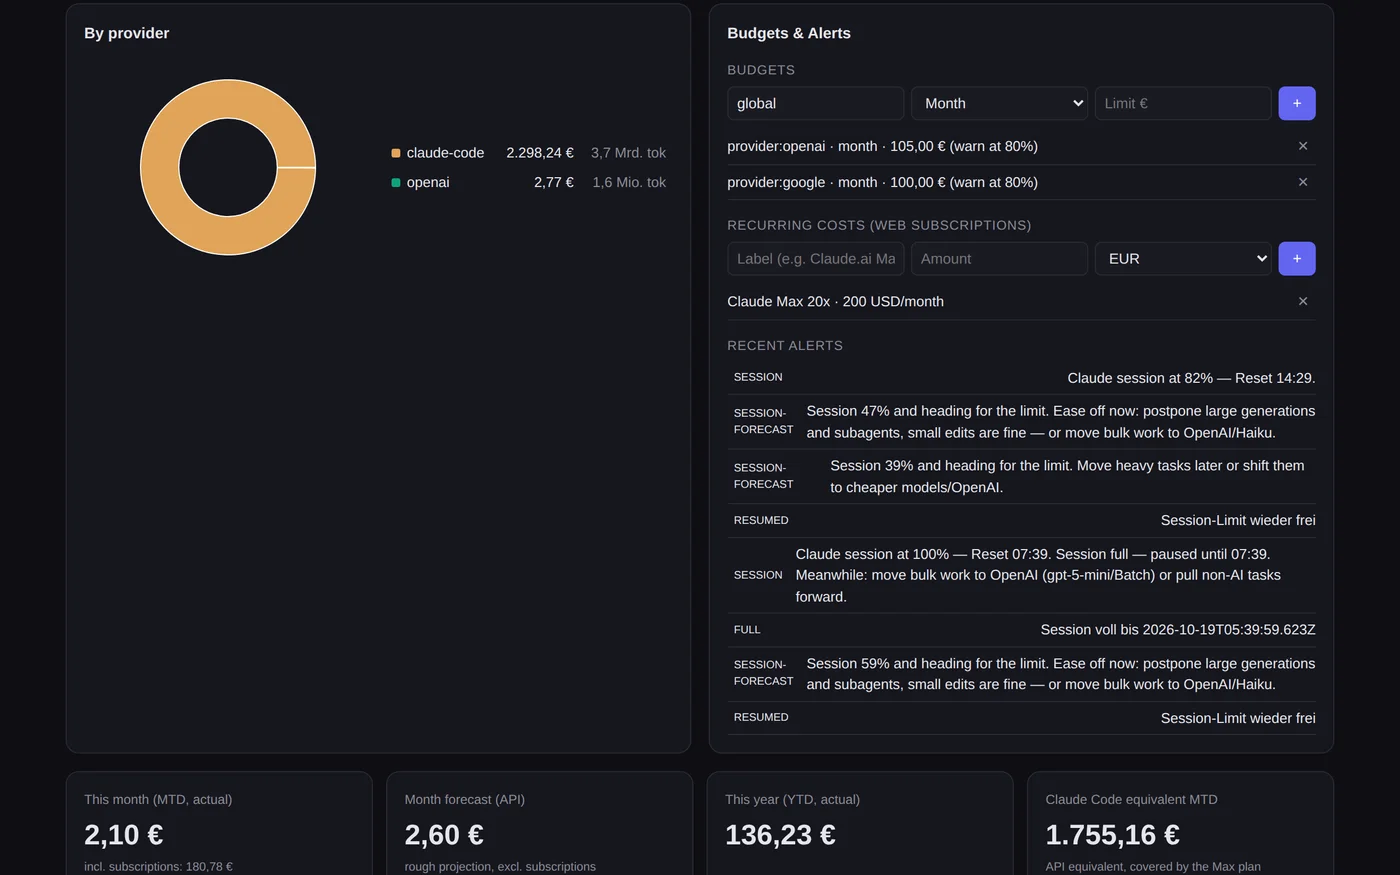
Noticed while rolling out, and only because it failed: the test run on the server aborted with “database is locked”, because the running service holds the same file open. That was the lucky version of this bug.
With the service stopped, the run would have passed — and left test rows lying among real costs, because the new tests create provider entries and write exchange rates. A green suite, and a quietly polluted dashboard.
Since then an environment variable bends the database path, the test run points at a throwaway file in the temp directory and deletes it before each run, and one test does nothing but watch that path: if it ever points at the production file again, the suite goes red instead of nobody noticing. A self-test that writes into the state it is testing gives an all-clear it never earned.
The Mac lends the server its login
3c3df62 13 Aug 2026
At 03:16 the server’s login token expired, and at 08:18 the credentials file was overwritten with empty fields. That killed the five-hour display outright: it is the one figure with no local substitute, while the weekly figure lives on from the local logs.
The obvious fix is to log in again on the server. It holds until the next expiry, which is to say for a few hours. Instead the workstation now supplies the values: Claude Code runs there all day, its token is refreshed continuously, and the agent reports every two minutes anyway. The token stays on the Mac. Only the percentages travel, and the conversion happens once, on reading, with the same function the local path uses — two conversions of the same answer drift apart sooner or later.
Anything older than fifteen minutes is not served at all. Old percentages presented as live would be worse than an honest gap. Where the number came from is written under the tile, so the display never claims a source it does not have.
A projection instead of a bar — and a chart that was empty for a reason
090f0f4 13 Aug 2026
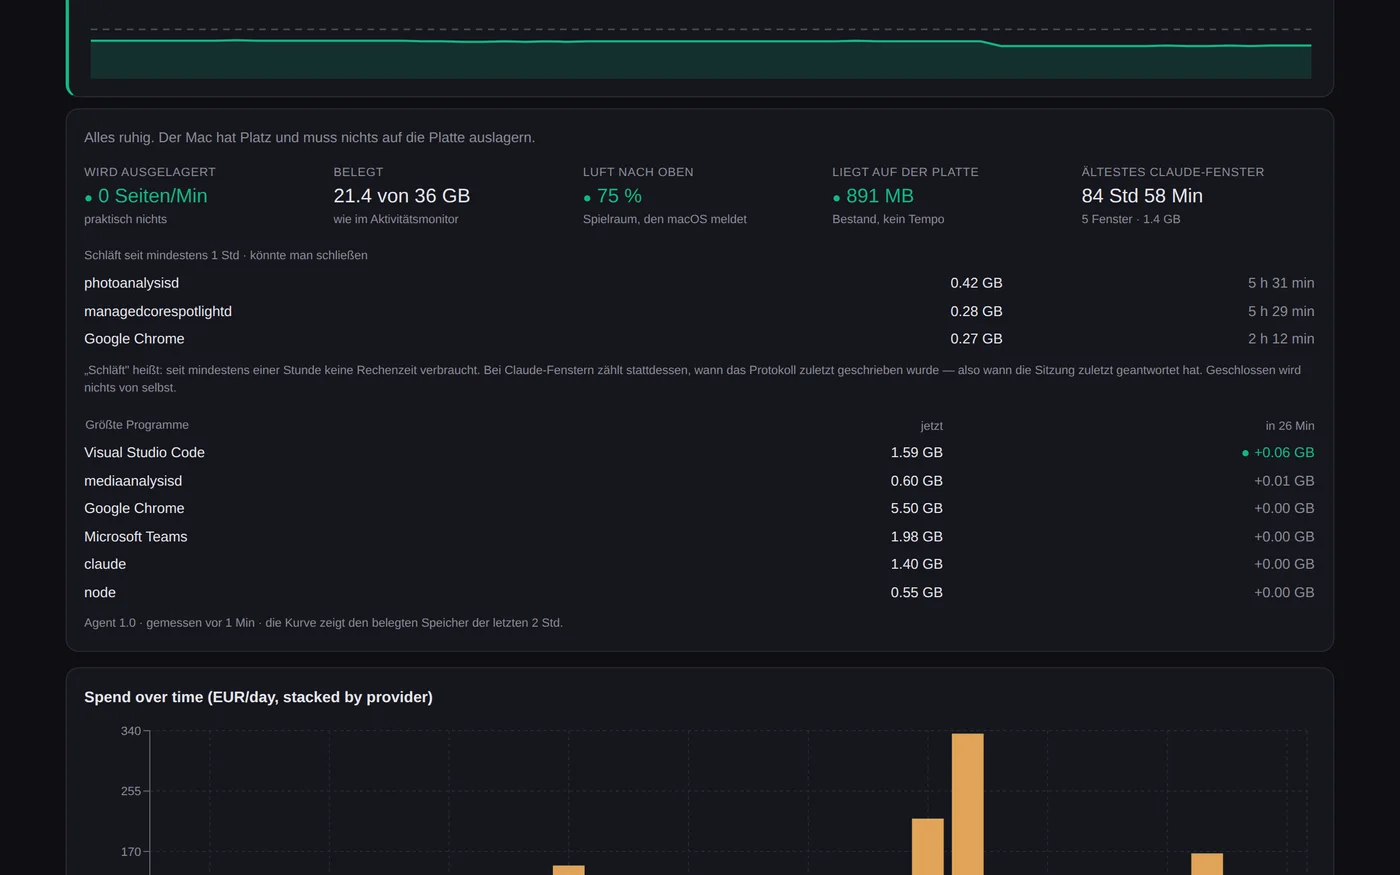
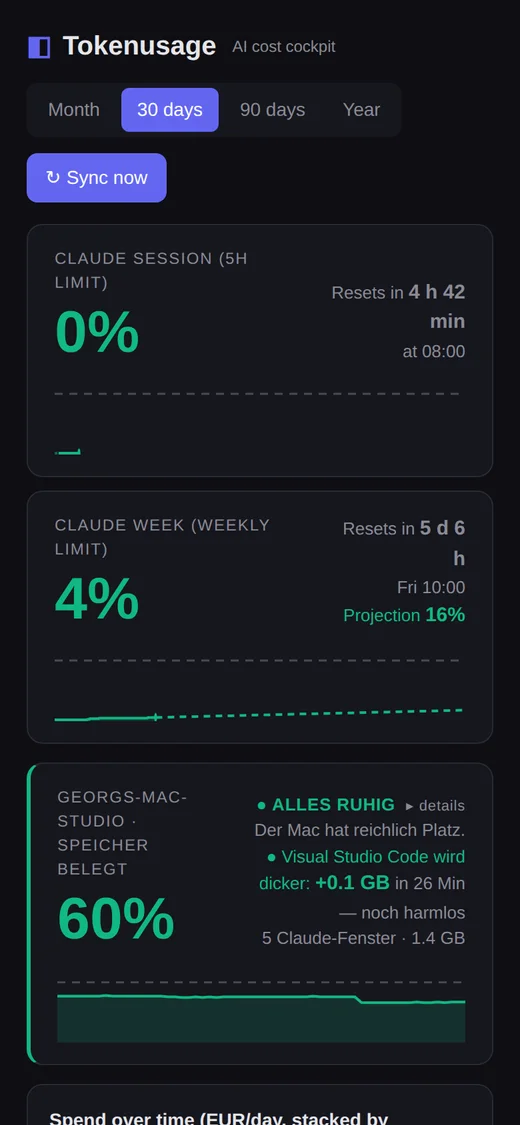
The bar showed the level, which the number next to it already said. What it did not show is whether the pace is survivable. Both tiles now carry a chart instead: solid where it was measured, dashed where the current pace lands, and a horizontal line at 100 %.
The curve is recorded rather than calculated. Since that day the workstation sends the unchanged usage response along every two minutes, which makes a time series out of a percentage. What lies before the recording started is drawn dotted and pale instead of smooth — for the weekly window that would otherwise be most of the picture, and nobody watched it.
The bug found while building it is the reason this beat exists. The reset timestamp wobbles: in fifty-nine consecutive reports there were fifty-nine different values, about a second apart, because the field is evidently computed as “now plus what is left”. The exact string comparison I had used to pick out the current window therefore never matched once, and produced an empty chart. That fails silently — an empty chart looks exactly like “no data yet”. Tolerance instead of equality, and five tests to hold it.
At the wall a forecast is worthless, so the tile gets out of the way
889ee06 13 Aug 2026
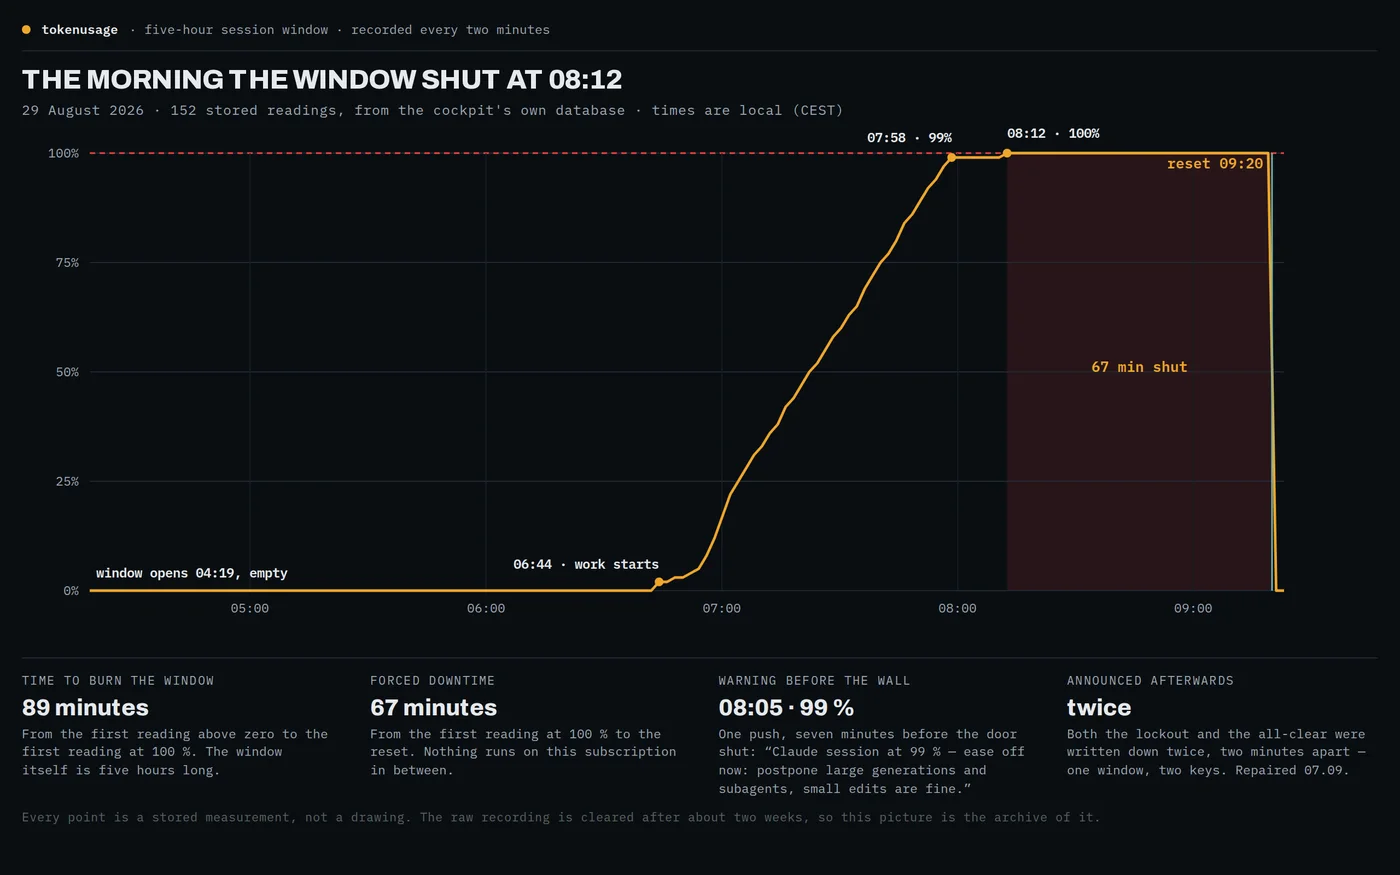
Two things in one commit, and they belong together. The first was a push alarm that fired at three megabytes of paging. The measurement was right and the alarm was wrong: in the recorded data 206 pages arrived in a single two-minute reading, then nothing, with memory 82 per cent free throughout. The threshold of 100 pages per minute had been guessed. It is now a ten-minute window and 500 pages per minute, and the real false alarm is kept as a test that has to stay quiet.
The second is what this page is named after. At a full limit the tile gives way to a screen of its own: LIMIT REACHED, the time you can continue at, and a countdown. In that moment there is exactly one question, and the answer belongs in a size you can read from the other end of the room. Percentage, curve and projection are meaningless there — the level is 100 and the extrapolation leads nowhere.
And the all-clear arrives as a push within two minutes of the window reopening, because the workstation’s report carries the session level anyway; the hourly check would have been up to fifty-nine minutes late. The marker for it lives in the alert log rather than in memory: a restart during the forced pause would otherwise erase it, and that is precisely when the all-clear would never come.
The tile colours by where it is going, not by where it stands
58b9667 13 Aug 2026
Georg’s question was: why is 68 % yellow when we are going to land under 80? It uncovers two faults.
The first: the big number coloured itself by the level — yellow from 60, red from 85. On a window that resets, the level on its own says very little. 68 % on a Monday is a different thing from 68 % an hour before the reset. What matters is whether the limit will fall, and that is what the projection says. A tile whose number warns while the forecast beside it says “this is fine” contradicts itself, and a display that contradicts itself is not read, it is clicked away. The one exception upward: at 100 you are at the wall regardless of what any extrapolation claims.
The second: the warning class sat on the container that encloses session and week together. The weekly tile therefore wore the session’s orange frame without having any reason of its own — the neighbour’s alarm looked like its own. Both decisions now live inside the tile and are derived from its own two numbers, so the call sites cannot drift apart, because they no longer pass a colour at all.
A change of plan makes a measured budget a lie
0496127 15 Aug 2026
The weekly limit is known to Anthropic only as a percentage. What one per cent is in money, the cockpit measures for itself, by averaging its last ten calibration points. That calculation carried a silent precondition: the same plan throughout. In the middle of a week the subscription went from one tier to a larger one, and from then on the averaged budget described a plan that no longer existed — for about two and a half days, until the old rows would have fallen out of the window by themselves.
Three stages now separate the tiers, because no single one of them is enough. The tier name out of the token is exact but slow: it is only rewritten when the token is refreshed, which happens every four hours. A fall in the live curve is fast but ambiguous: inside a window consumption can only rise, so a drop of more than three points is a different limit rather than lower usage — but a weekly reset also falls to zero, and only the comparison of the window itself tells those apart. And when averaging, a row that deviates by more than 35 % ends the series, which catches the downgrade, where the percentages rise instead of falling.
Until the new budget has been measured, the tile shows no invented number. Percentage, projection and reset stay — those come in live and are correct — and the money figures stay silent, with the reason written where they would have stood. An unknown tier, which is what an expired token looks like, deliberately does not count as a change of plan: otherwise a login failure would delete the weekly budget.
What the real data showed on the first day
a737c58 15 Aug 2026
Three findings the tests could not have foreseen, because they exist only in the real messages. At the moment of the switch, Anthropic reported the weekly reset time as null for one beat. The window comparison treated that as a foreign window and discarded exactly the pair in which the change was visible — the one that went from 27 % to 0 %. Points without a window are now dropped beforehand: they cannot be assigned, so they cannot separate anything either.
The tier name lags further behind than I had assumed. Hours after the upgrade the server was still reporting the old tier, because its token is only rewritten at the next refresh, while the workstation had long since reported the new one. A detected break therefore beats the label: whatever lies after it belongs to the current plan, whatever the line is called. Without that rule, the later name change would have thrown away the freshly measured budget a second time.
The most expensive one is the third. At the switch the weekly level jumped back to 0, and the cost counter did not. The first new calibration would have divided three days of cost by four per cent — a multiple of the real budget, and it would have been published as “measured”. From a detected break onward, only what was consumed after it counts.
Every lockout was announced twice, and the fix for it had been written a week earlier
889ee06 0d0a9cb 242838d 4a6fffb 13 Aug 2026
The rounding above is the fix for one path. There is a second path, written a week later, and it did not get it. The key for the weekly window rounds to the full hour. The key for the five-hour window keeps the reported reset time down to the minute.
That reported time wobbles by less than a second — the very wobble the first fix was built for — and often enough it lands on the other side of a minute boundary. One window then has two identities: 07:19 and 07:20. The uniqueness constraint on the table, which is supposed to allow one alarm per window, allows two, because as far as it can tell these are two windows.
Measured in the production database on 7 September, over the period since 14 August: six real lockouts, twelve entries saying the limit is full, twelve saying it is free again. Every all-clear reached my phone twice, two minutes apart, every single time.
The interesting part is not the line, because a fix can be complete where it was written and absent one file away, and nothing about that is visible from either place: the alarm works, the deduplication works, and the number of alarms is simply double. What finds it is not a test but a count — how many alarms against how many events.
Repaired the same morning. The key rounds to the nearest minute now instead of truncating — the same lesson as the weekly path, one unit finer. Not the same function, though: the obvious substitution rounds to the whole hour, and this key is also used as a point in time, so the all-clear would then have arrived up to 30 minutes early, in the middle of the forced pause. There is a test against that too.
What took longer than the fix was proving the tests can see it. Both were run against the old line and against the wrong repair. The first version of the hour guard stayed green under both — an hour-shaped key produces an invalid date, the loop skips the entry, and no all-clear comes at all, so the test passed for a reason other than the one it claimed. It asserts the stored key itself now. 83 checks, and the two that matter go red the moment the old line goes back in.
What it does tonight
It runs as a service on the home server and is reachable only inside my own network; there is no public address, and this page is the only place it is described. Every two minutes the workstation sends its state and the two limit percentages. Every hour the cockpit pulls what the metered providers report. Once a day it fetches exchange rates, one per usage day, so that an old figure is never converted at today’s rate.
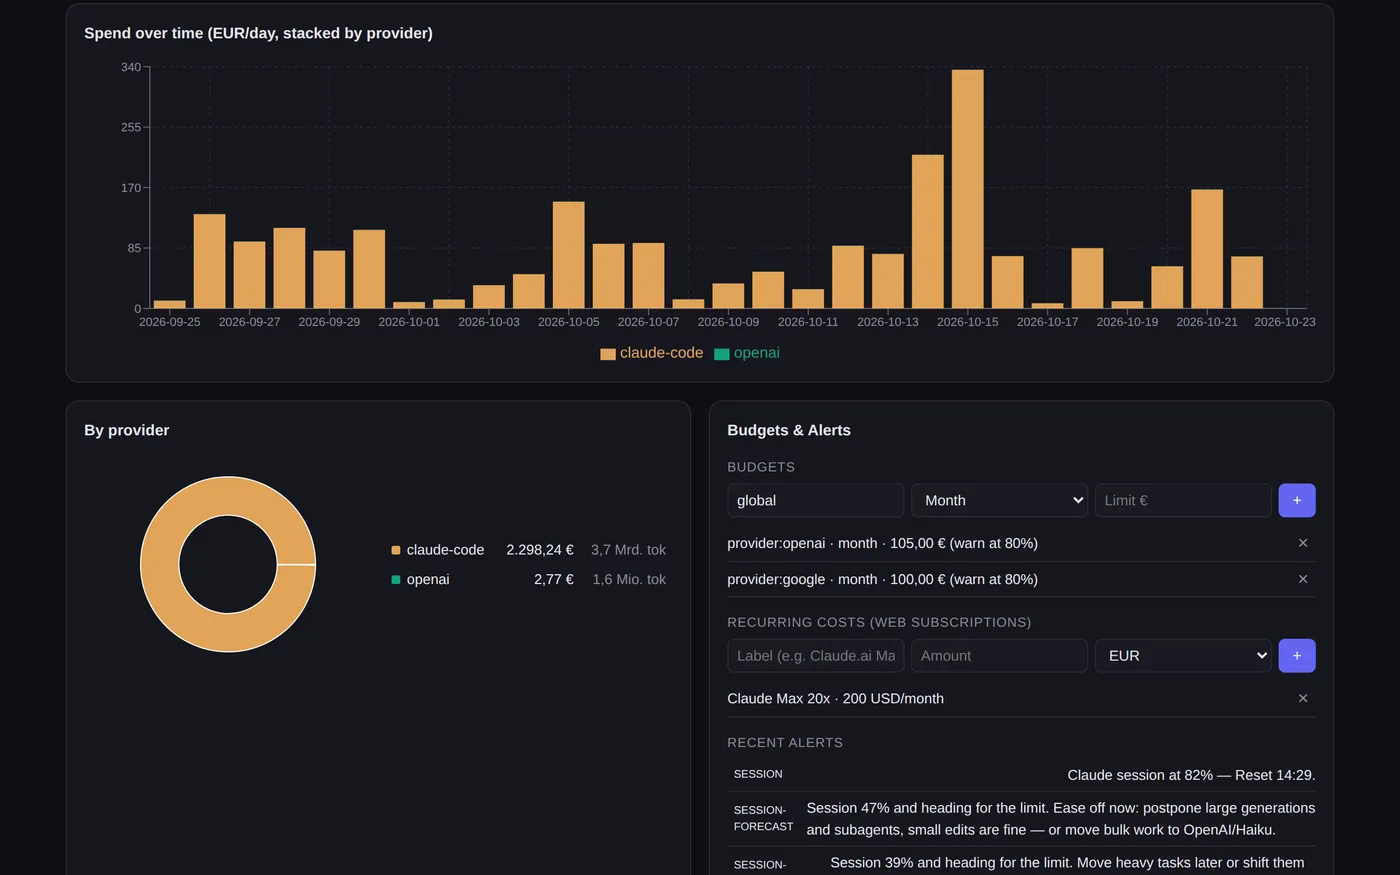
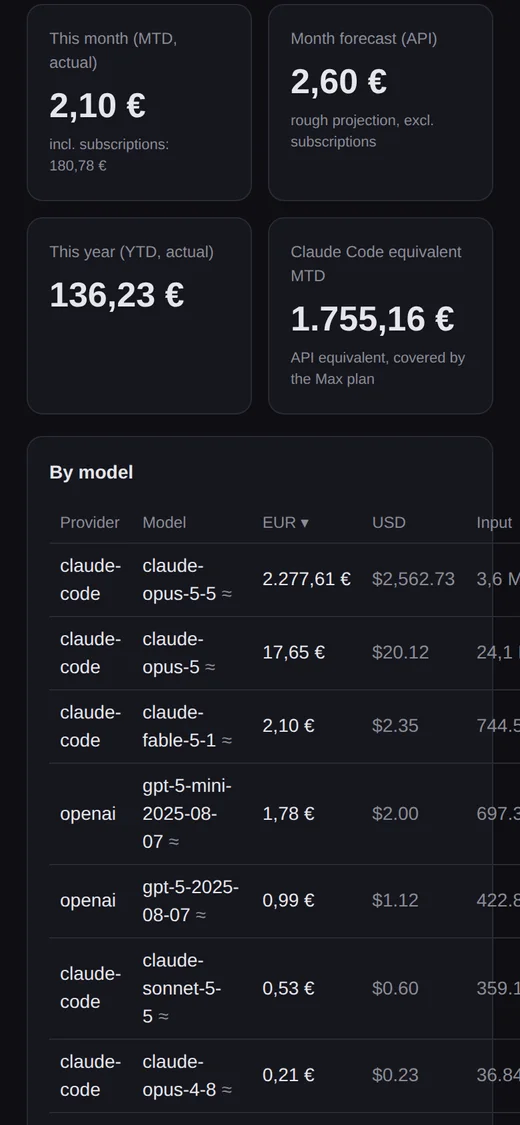
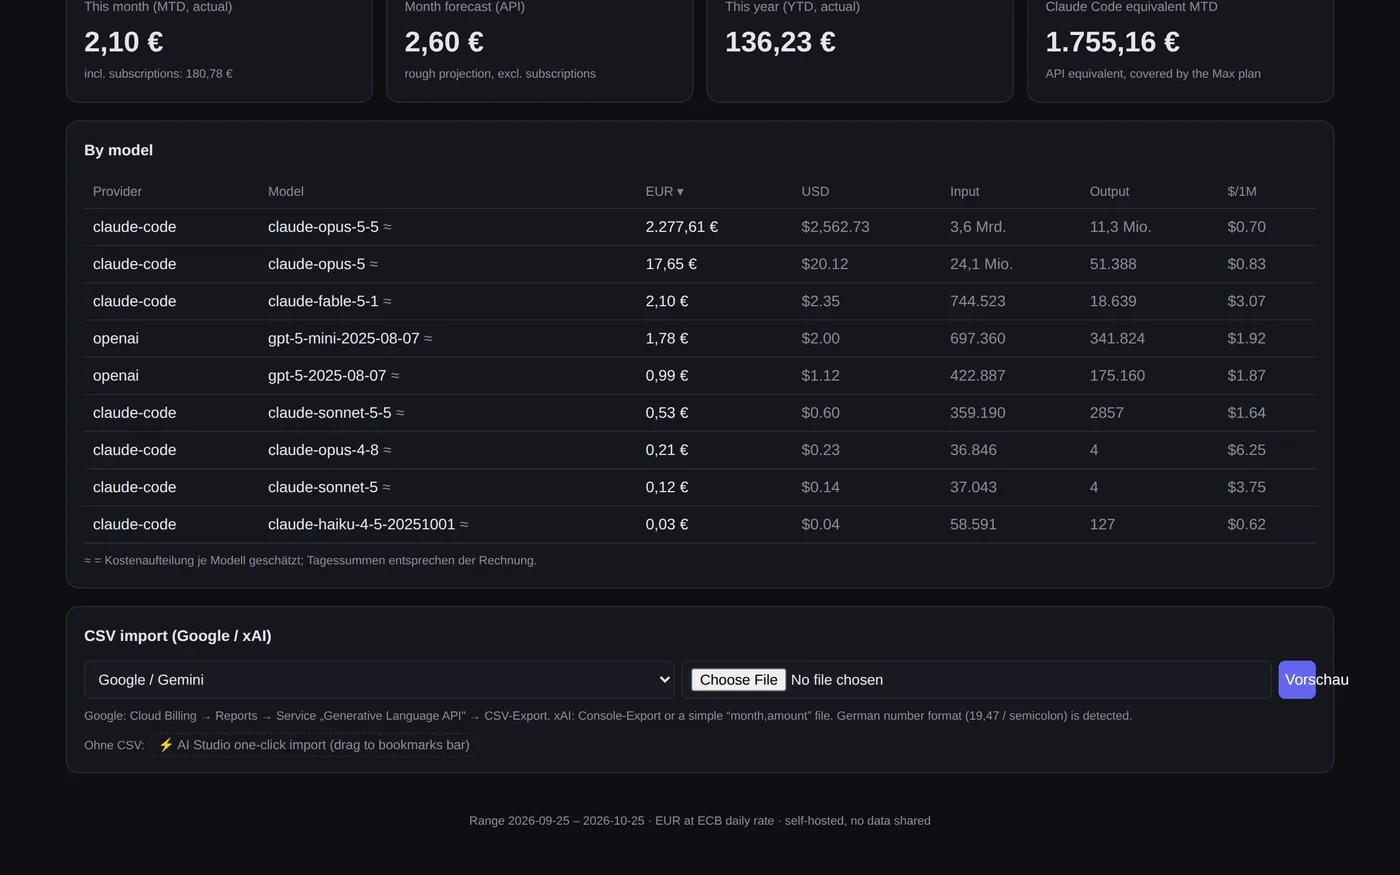
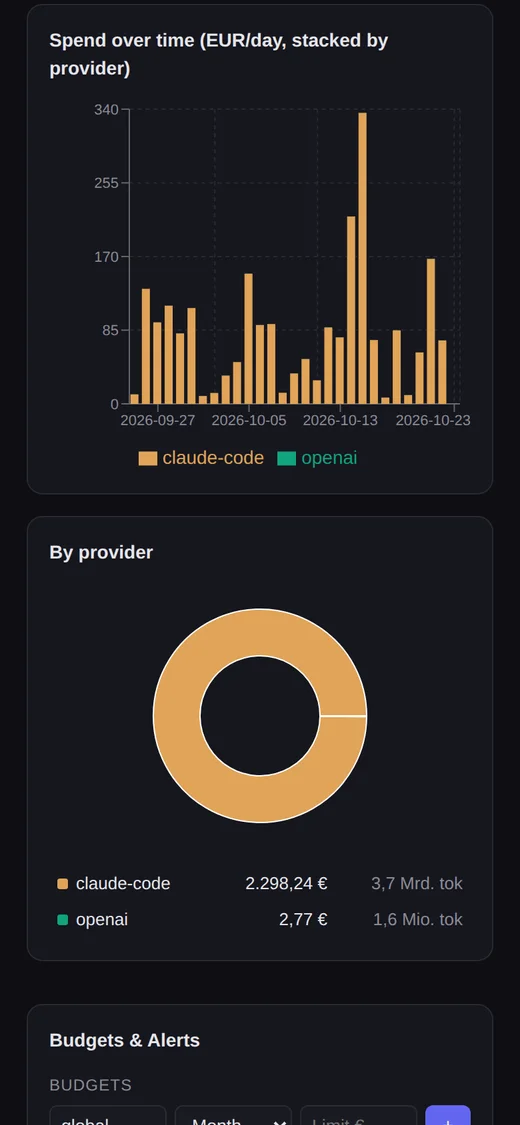
The book behind it holds 887 day-and-model rows across four providers and sixteen models, 126 days deep. The Claude side is booked as a list-price equivalent — what the same work would have cost through the API — because a subscription has no per-call price to record: 16,558.81 euros since 1 May across 92,295 requests, against a subscription of 200 US dollars a month. That ratio is why the subscription is not up for debate, and it is also why the five-hour wall exists at all.
The alert log holds 570 entries. Twelve of them are the one sentence I actually care about, and they describe six events — that gap is the fault below, found by counting them against each other and repaired the same morning.
Runs on its own
- a report from the workstation every two minutes: memory summed per program, the swap rate, and both limit percentages, kept as a time series
- hourly pulls from the metered providers, daily exchange rates, and every figure carrying the currency it arrived in
- a projection for both windows, coloured by where the pace lands rather than by where the level stands
- push to the phone for real alarms only, held between ten at night and seven in the morning and delivered afterwards
- an all-clear within two minutes of the five-hour window reopening, once per window since the repair below
Stays with me
- what to do when the projection says the window will not hold: postpone the heavy work, or move it to a cheaper model
- the import from the one provider that offers no interface for it, by bookmarklet, by hand
- deciding whether the subscription still pays, from the ratio the cockpit reports rather than from a feeling
- every judgement the tool refuses to make: after a change of plan it shows the reason instead of a number until it has measured again
The cockpit itself costs nothing to run: it calls no model anywhere. Every figure comes from provider interfaces, local logs and arithmetic. What it measures is the expensive part — 200 US dollars a month of subscription, plus 131.81 euros across the other three providers since the beginning of June.
Where this goes
The fault below is closed. The larger gap is a measurement I have not made: the cockpit says what was burned, never whether it was worth burning. The list-price equivalent is a bookkeeping device, not a verdict — it says what the same tokens would have cost elsewhere, not what they produced.
So the next step is to hold the spend of a night against what that night actually shipped. The run log of the nightly loops sits on the same machine, and until those two stand in one picture, every number here is an input with no output beside it.